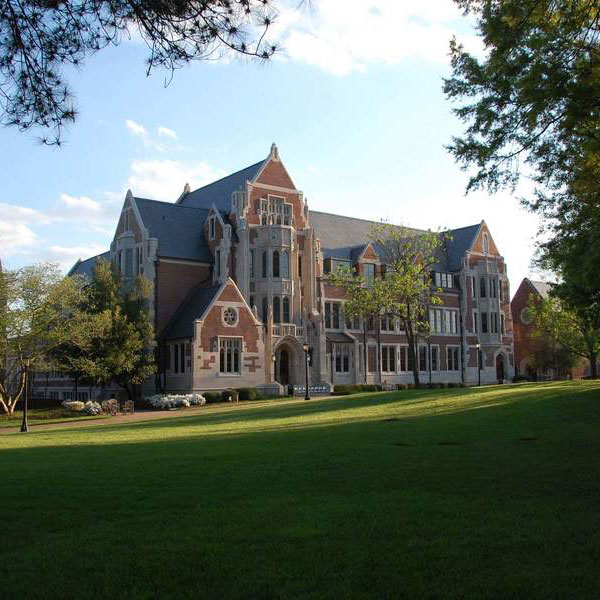
At Agnes Scott, you’ll find your people and develop your passion. Make the most of your undergraduate experience and get involved in activities that interest, fulfill and challenge you.
You're One of Us
You'll participate in the same fun and meaningful college traditions as generations of Scotties before you. From your first Black Cat Week to ringing the bell after accepting your first job offer, each experience connects you to our proud community.
Sophomore Ring Ceremony - As an Agnes Scott rite of passage, sophomores receive black onyx class rings alongside their peers, surrounded by family and friends.
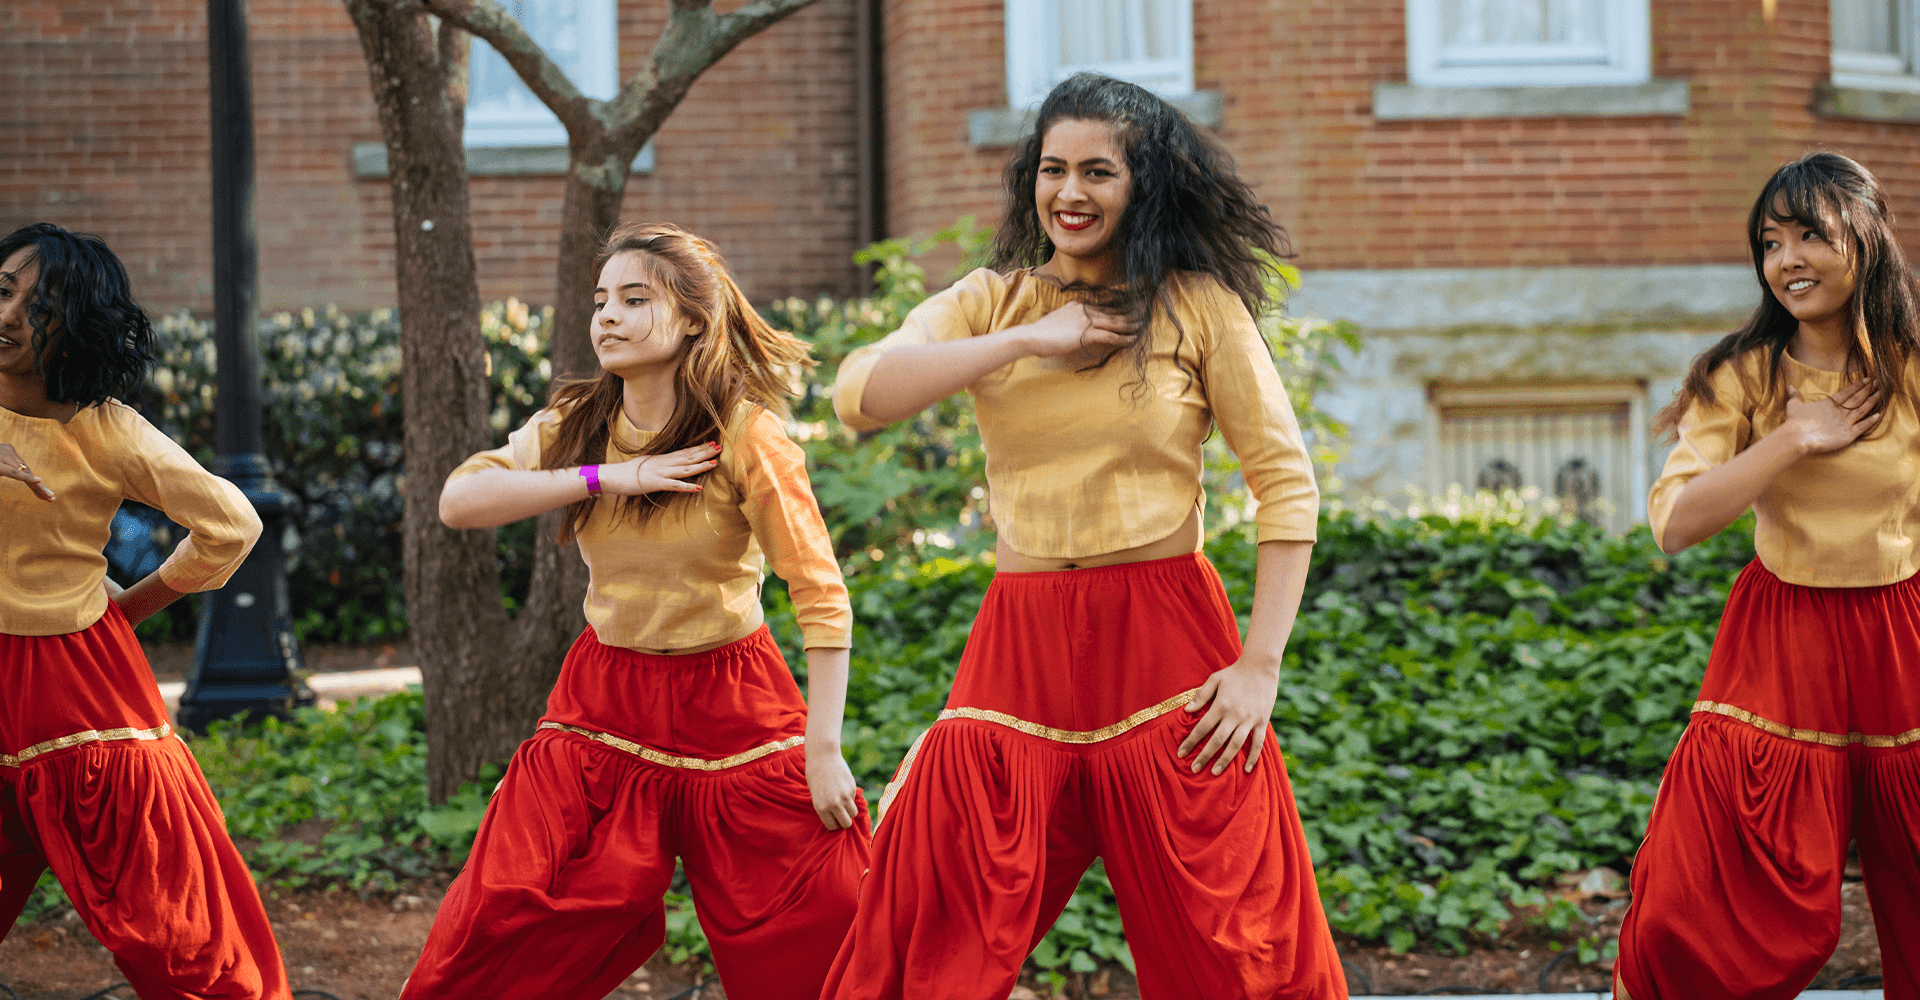
AgnesPalooza - We come back from spring break with a bang! AgnesPalooza is a week full of events including a festival, a dance party and many other events.
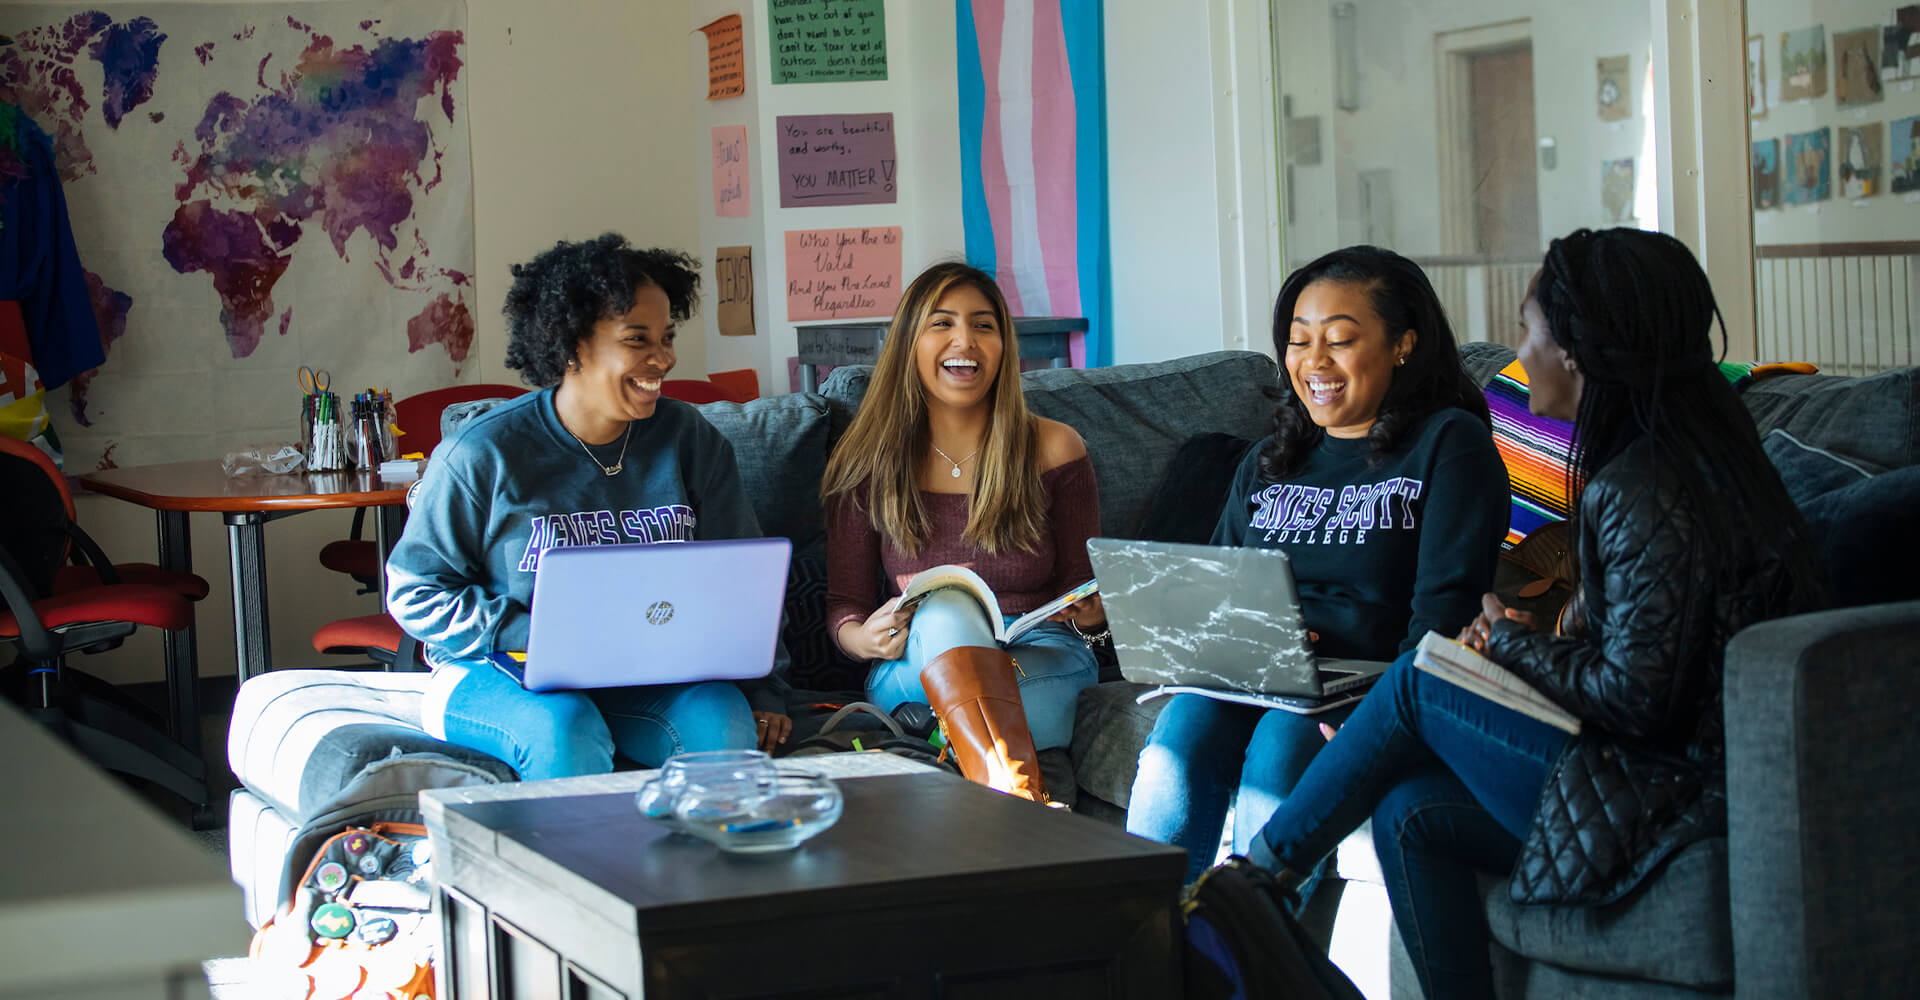
Get Involved
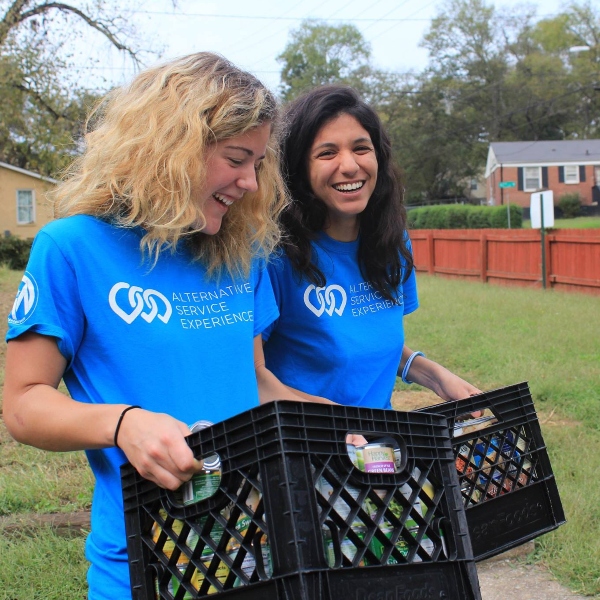
Do you have a cause that is close to your heart? Two? Three? You’re among friends. Students have endless opportunities to get involved. We have over 60 student organizations. Our students are part of the college governance system. And more than 80 percent of Agnes Scott undergraduate students are actively involved in community service.
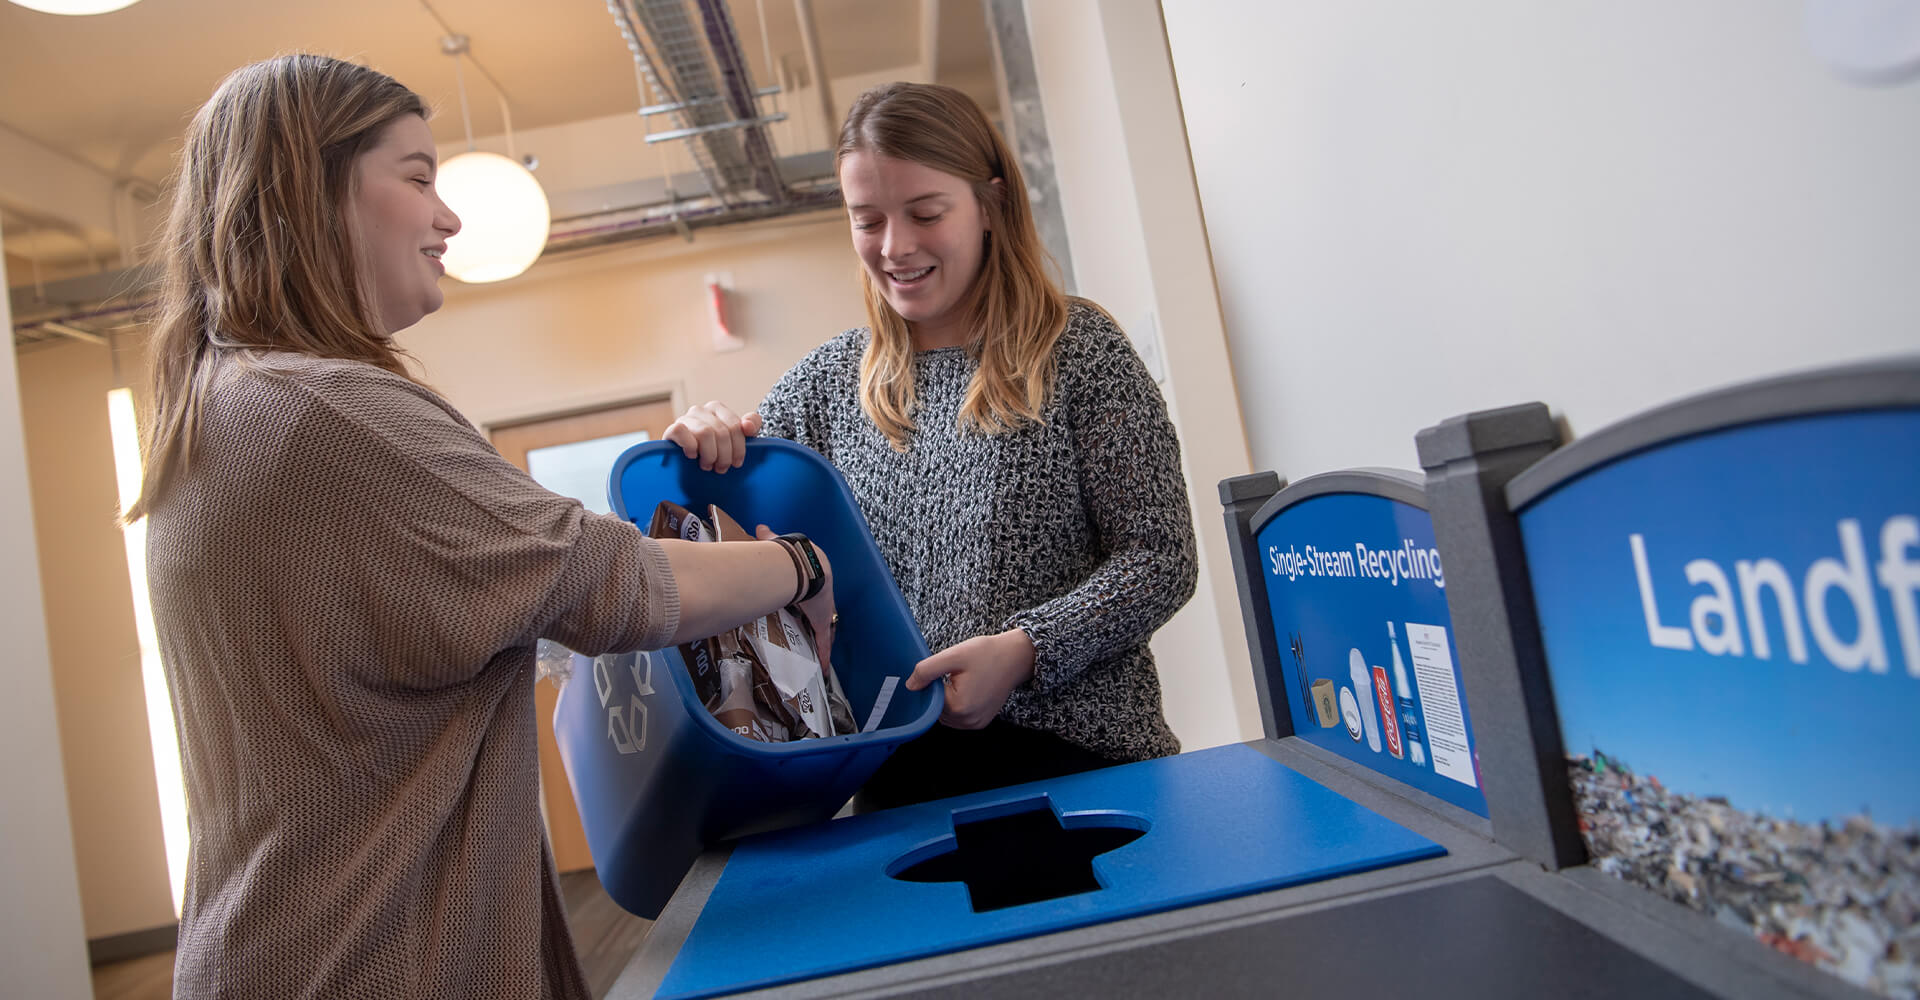
The Green Team is a group of students, staff, and faculty that focuses on solutions to day-to-day environmental concerns.
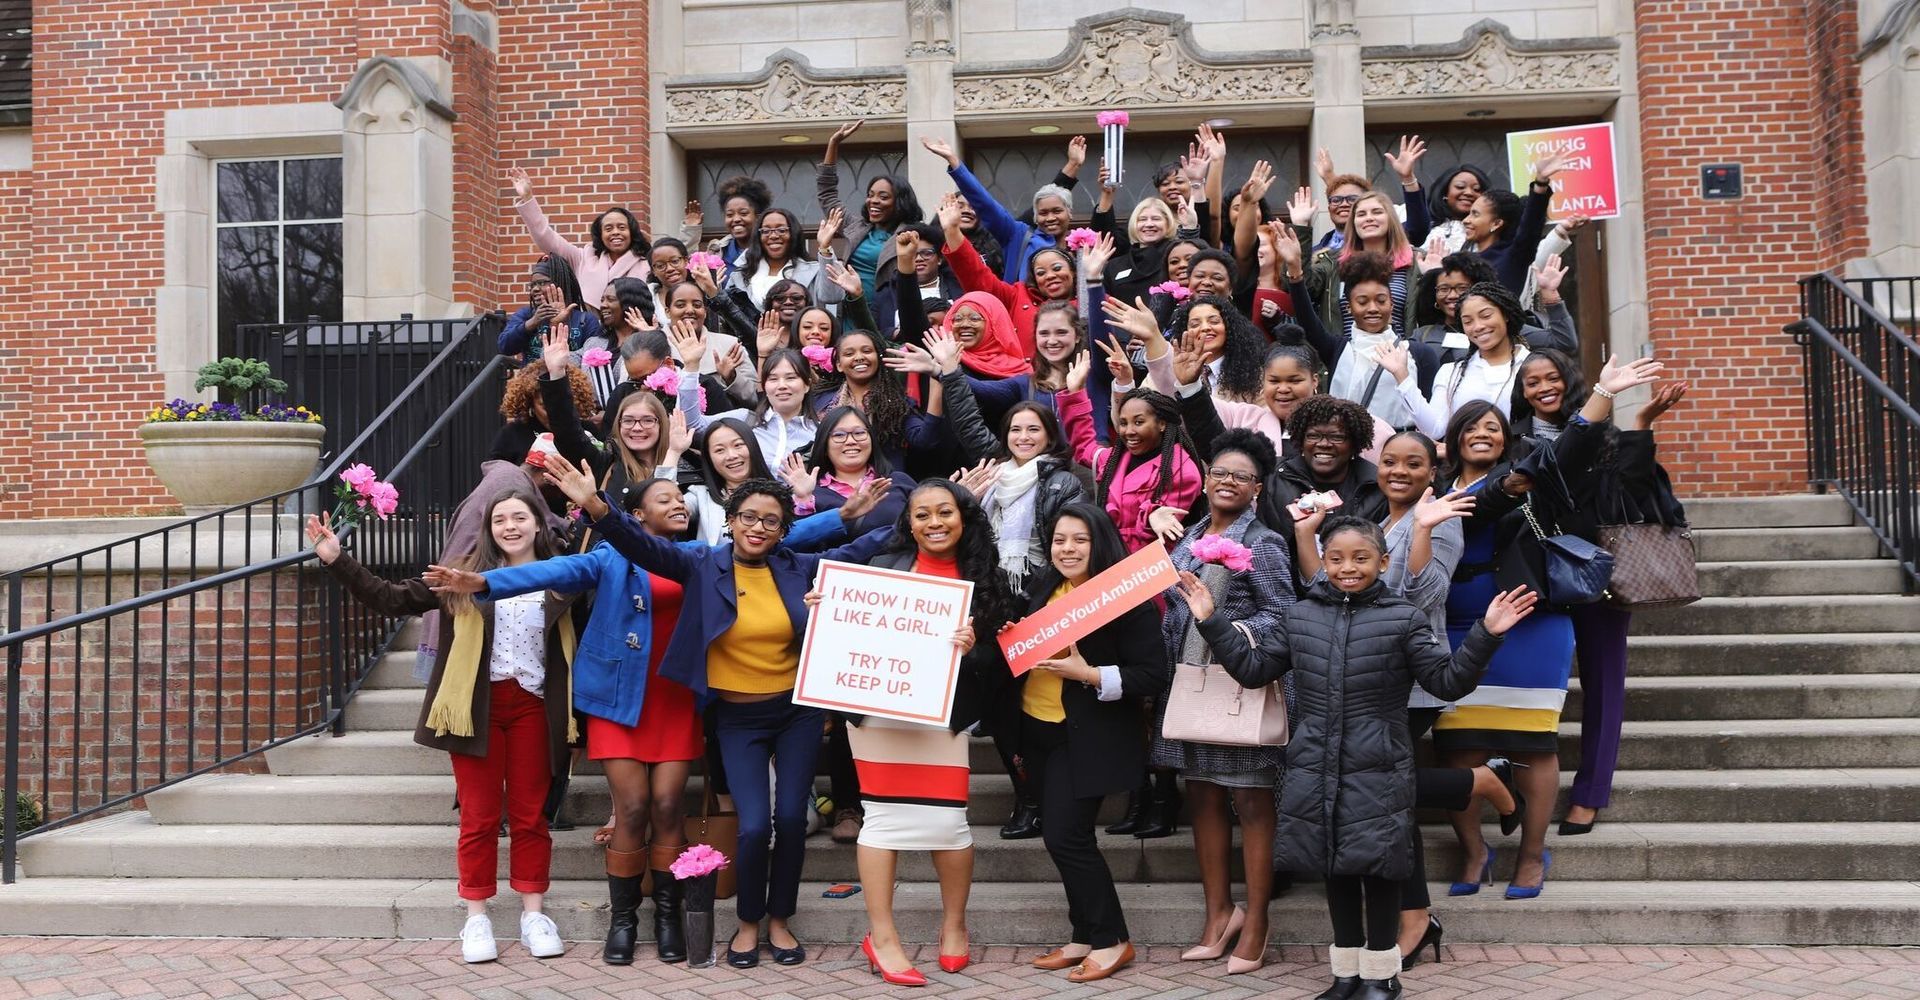
Agnes Scott students lead the way in political and civic engagement, exemplifying the college’s commitment to informed, active citizenship.
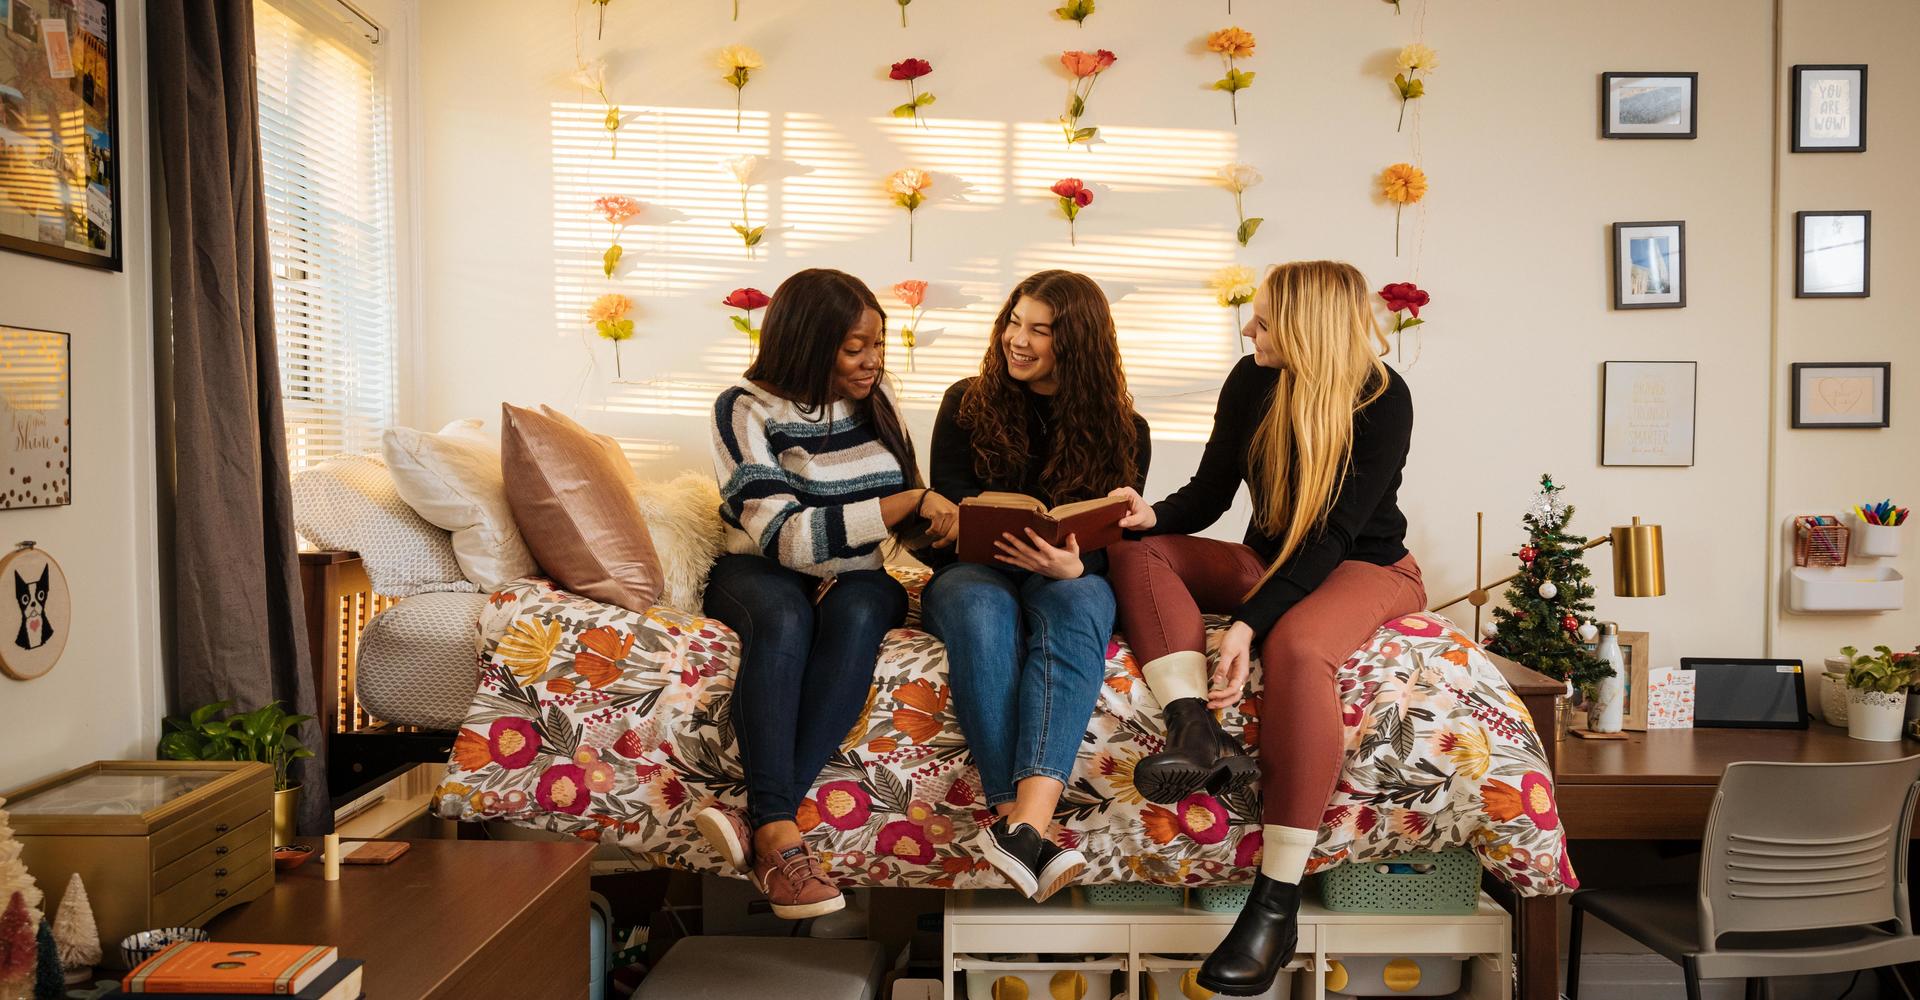
Feel At Home
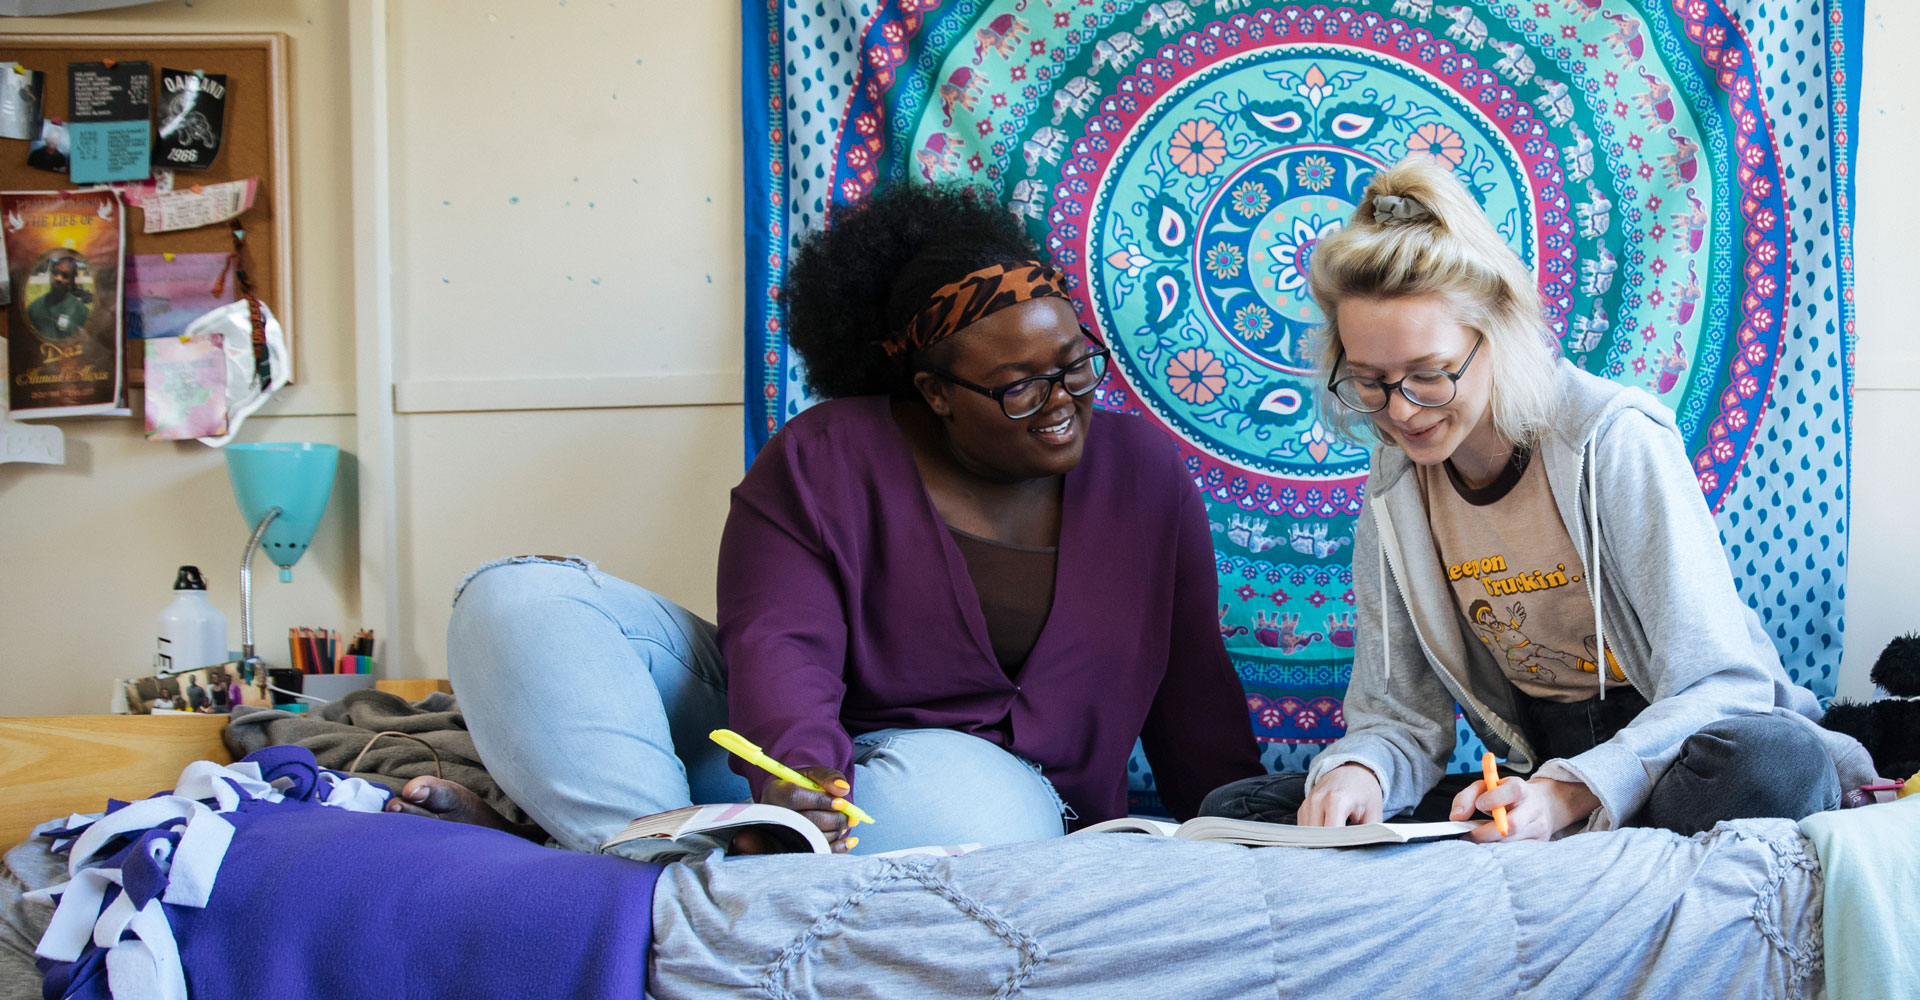
Living on campus is a time-honored tradition. As a first-year, you’ll have the opportunity to live near classmates with similar interests—making it easy to find new friends. Grab a meal with friends in our historic dining hall, then get a coffee at Black Cat Cafe and hit the books.
You might live at Winship Hall, a traditional first-year residence hall housing 150 Scotties.
Join a mix of first-years and upperclassmen who live in Walters Hall.
Living-Learning Communities - Expand your education through shared learning experiences. Join one of our three LLCs, focused on STEM, Leadership Development, or Global Learning.
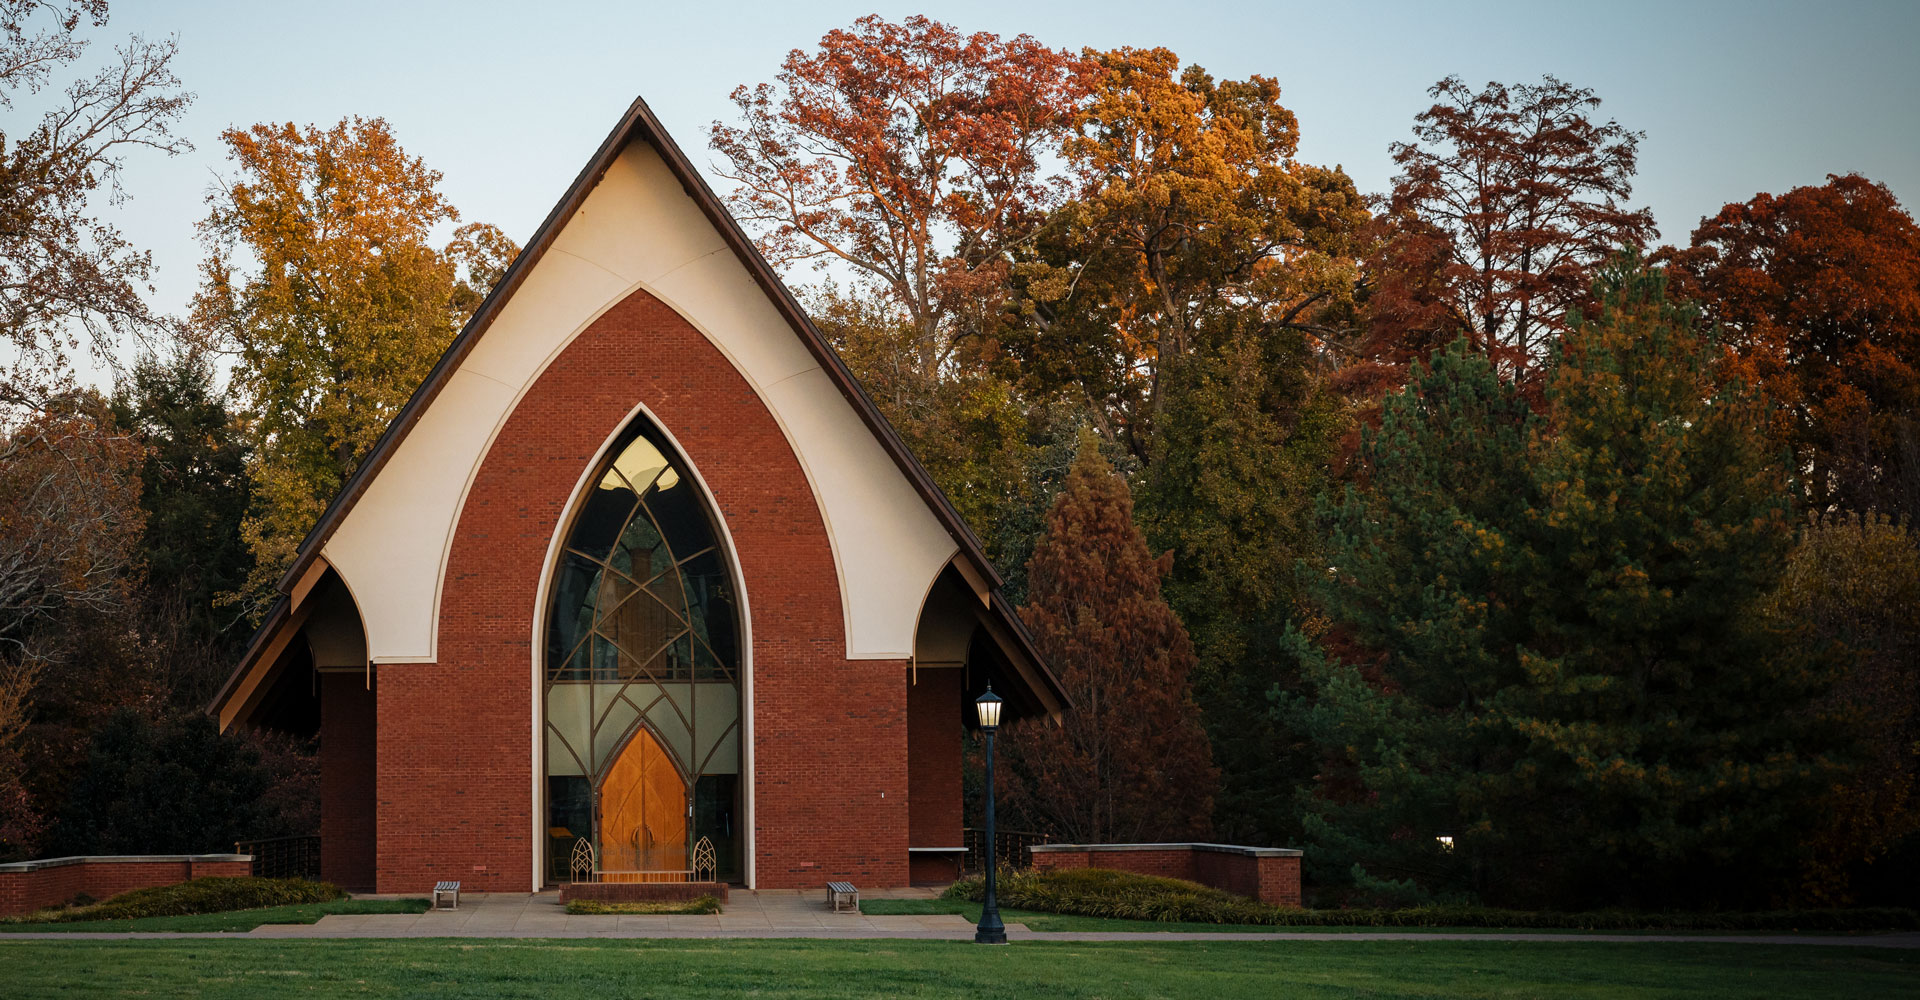
Lift Your Spirits
Our community values and respects all faith traditions. If you’re looking to grow spiritually, we offer opportunities for worship, fellowship, service and study.
Julia Thompson Smith Chapel - The Christian chapel welcomes people of all faiths, features a multi-faith meditation room and serves as the spiritual center of the campus.
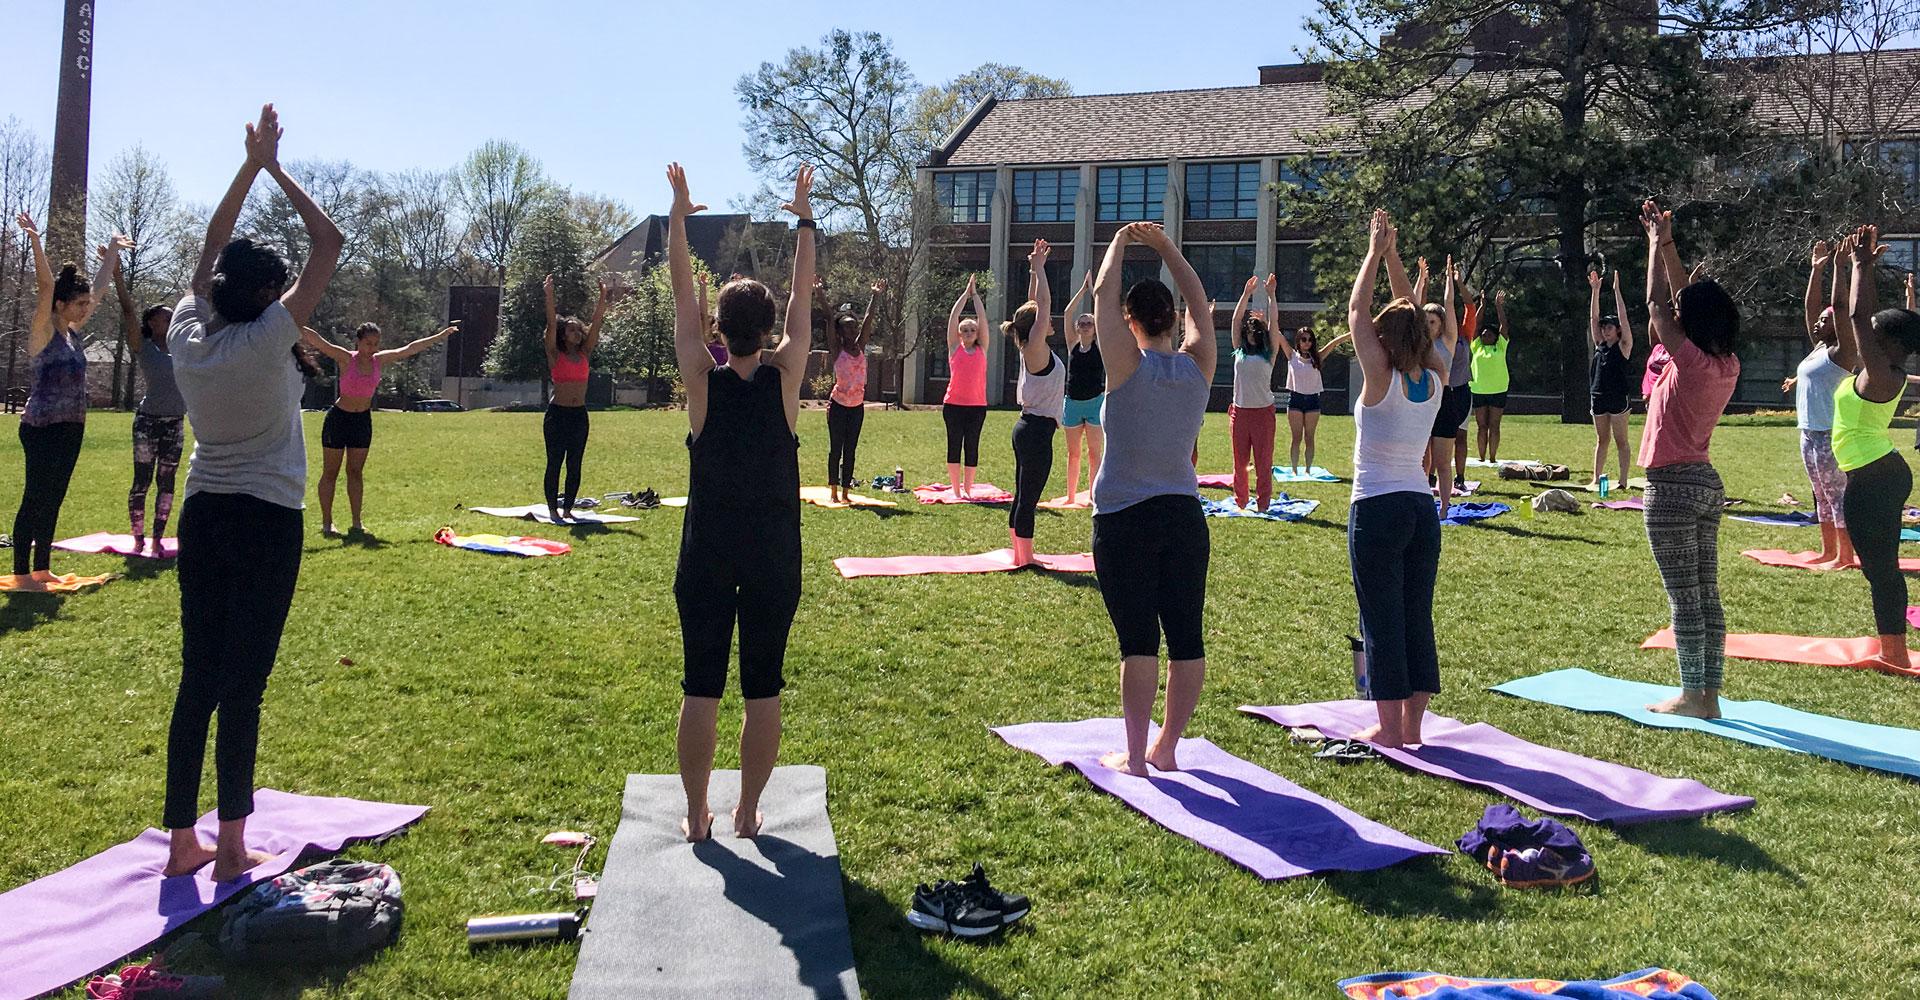
Stay Strong
We're here to help you stay physically and mentally healthy during your time at Agnes Scott. Our Wellness Center offers medical care, confidential counseling services, health education and more.
Take our weekly water aerobics, yoga, and meditation classes with your friends — or make some new ones! You’ll also receive a free membership to Snap Fitness Decatur.
Counseling and Psychological Services (CAPS) - CAPS offers confidential counseling sessions for individuals, couples, or groups. We'll help you navigate any issues or challenges that might arise during your time on campus.